Tide-aware coastal mapping.
see1m combines seabed, shoreline and tide information into a single coastal map. The examples below show different coastal areas rendered using the same mapping and visualisation workflow.
What see1m does
Navigation layers
Display depth-based navigation layers using either the current tide or a lowest-tide reference.
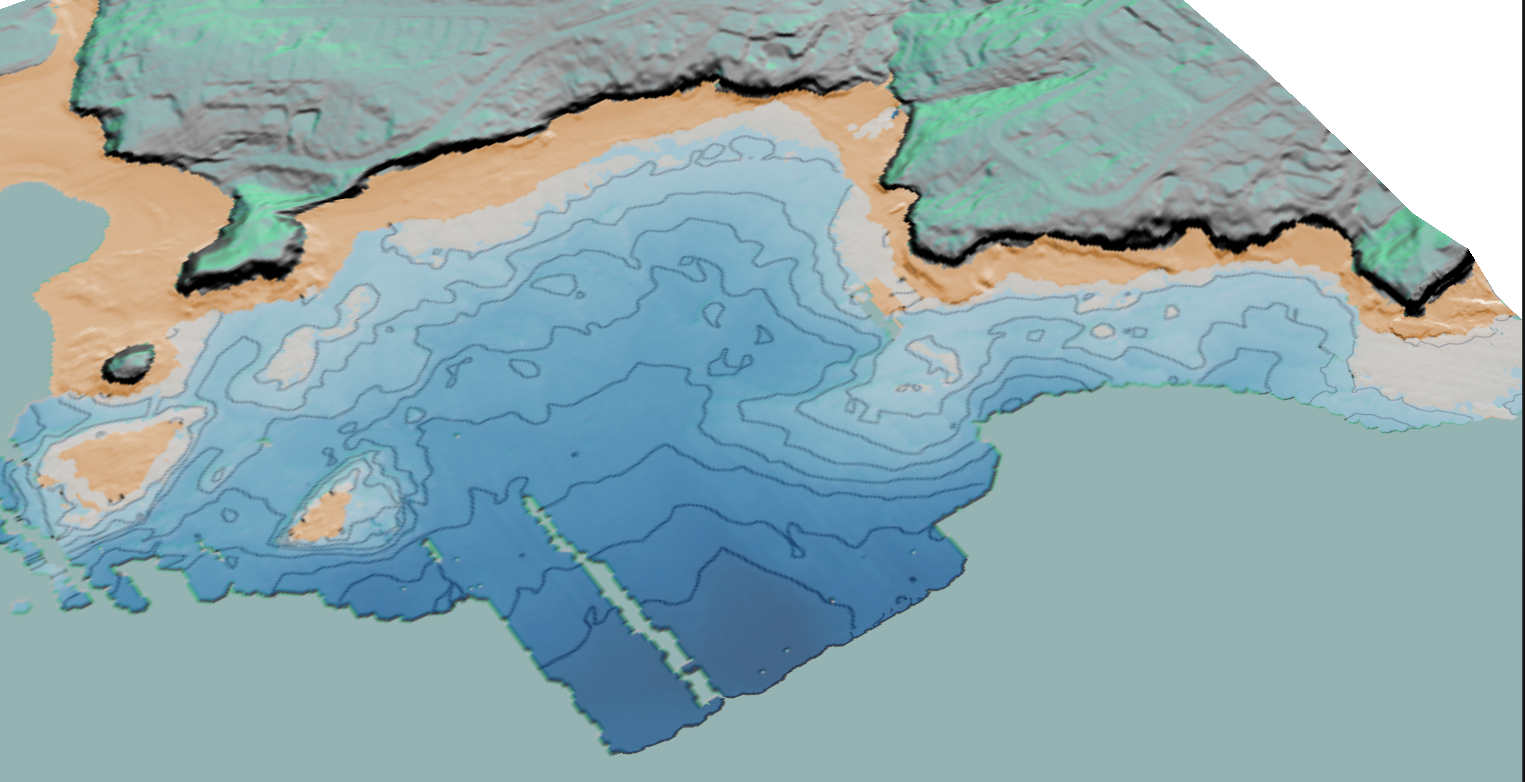
Seabed mapping
Combine available elevation and seabed datasets into a continuous coastal surface.
Coastal projects
Apply the same workflow to individual bays, estuaries and coastal survey areas.
Live coastal examples
The examples below use the same viewer and processing workflow across different coastal environments and source datasets.
Torbay
Development area used for testing seabed mapping, tide-aware layers and shoreline visualisation.
▶ Open TorbayTairua
Tidal harbour and residential waterway example showing tide-dependent navigation routes and estuary access.
▶ Open TairuaWhangamata
Harbour and estuary-scale example using the same tide-aware see1m water playback and depth workflow.
▶ Open WhangamataWharekawa
Estuary and coastal margin example prepared for tide-aware water extent and intertidal visualisation.
▶ Open WharekawaMangawhai
Large estuary example for showing moving water, channels and safe navigation layers through the tide cycle.
▶ Open MangawhaiMangonui
Large tidal harbour and estuary system showing channels, tidal water extent and areas where additional survey coverage may be added.
▶ Open MangonuiMatarangi
Barrier beach estuary example showing tide-driven access, shallow channels and late-filling estuary behaviour.
▶ Open MatarangiDunedin
Large harbour-scale example showing tide-aware water extent, safe navigation layers and harbour-wide coastal surface behaviour.
▶ Open DunedinWorld
Global rainfall, seasonal movement and water-state visualisation using the see1m tissue workflow.
▶ Open WorldRelated system: Rain → Stream → Coast
Related project
Rainfall and flow visualisation project developed alongside see1m using a similar browser-based approach.
- Rainfall history replay
- Catchment and stream response context
- Browser-based visualisation